Vr Mapping |
ON-LINE REFERENCE DOCUMENTATION CARDINAL SYSTEMS, LLC |
Model, Drive Control (ModDrC)
Type: Stereo Model Management
Drives to all control points in all models to generate a report of control point measurements in models.
Detailed Description
This application drive the operator from model to model to measure all the control points in the block in every model that see them. The measurements are used to generate a report of the accuracy of the models. In order to use the tool you must first open multiple models in the Model Manager (ModMan).
Procedure
1. Open multiple models in Model Manger (ModMan).
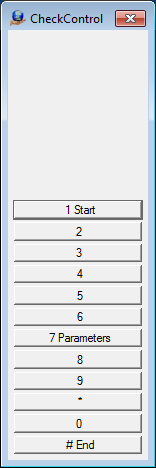
2. Start Model, Drive Control (ModDrC). The first menu allows the user to edit the parameters and chose a control file before beginning the measurement process.
|
The model precision application menu.
|
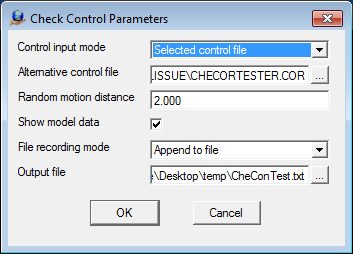
3. You may also wish to change the parameters:
|
Parameters:
|
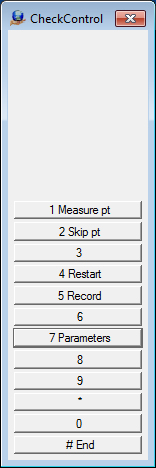
4. Left click or push F1 to start measuring. The application will drive to all the points to measure. The menu options during this phase.
|
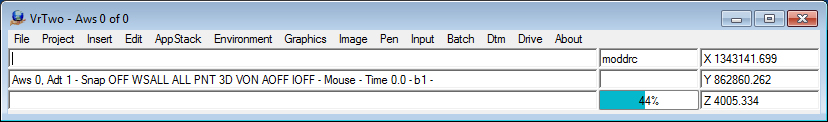
Your progress through the stack of models is show on the main window as shown below.
|
6. The accuracy statistics are saved to the output file. Below is an example with model specific data turned on. Root mean squared error, or RMSE, is with regard to the differences of individual measurements from the control coordinate. The maximum differences are the maximum deviations from the mean in each axial direction. RadL and RadR are descriptions of how far a point was away from the center of the raw image. 100% is as far away as possible, 0% is exactly in the center.
Combined Measurement Statistics
Total Control Points: 9
Total Measurements: 27
Root mean squared errors: 0.066 0.100 0.126
Maximum differences: 0.154 0.013 0.057
Minimum differences: -0.108 -0.192 -0.260
Point: 6096047 measured in 4 models.
Root mean squared errors: 0.074 0.107 0.125
Maximum differences: 0.100 -0.081 0.057
Maximum differences: 0.100 -0.081 0.057
Control location: 1341430.407 863156.506 4016.130
Model specific Data
ModelName resX resY resZ RadL RadR LeftImage RightImage
1_0009_1_0010.vmo 0.100 -0.123 -0.163 44.649% 31.224% 1_0009_1_0010-L-1_0009.tif 1_0009_1_0010-R-1_0010.tif
1_0010_1_0011.vmo 0.015 -0.122 -0.091 31.228% 60.627% 1_0010_1_0011-L-1_0010.tif 1_0010_1_0011-R-1_0011.tif
2_0022_2_0023.vmo -0.108 -0.095 -0.155 11.108% 52.828% 2_0022_2_0023-L-2_0023.tif 2_0022_2_0023-R-2_0022.tif
2_0023_2_0024.vmo 0.008 -0.081 0.057 31.456% 11.101% 2_0023_2_0024-L-2_0024.tif 2_0023_2_0024-R-2_0023.tif
Point: 656 measured in 4 models.
Root mean squared errors: 0.066 0.150 0.156
Maximum differences: 0.120 -0.103 -0.003
Maximum differences: 0.120 -0.103 -0.003
Control location: 1343154.058 862869.793 4005.250
Model specific Data
ModelName resX resY resZ RadL RadR LeftImage RightImage
1_0012_1_0013.vmo 0.120 -0.155 -0.260 62.483% 50.704% 1_0012_1_0013-L-1_0012.tif 1_0012_1_0013-R-1_0013.tif
1_0013_1_0014.vmo -0.008 -0.103 -0.111 50.705% 65.060% 1_0013_1_0014-L-1_0013.tif 1_0013_1_0014-R-1_0014.tif
2_0019_2_0020.vmo 0.012 -0.192 -0.131 24.920% 53.391% 2_0019_2_0020-L-2_0020.tif 2_0019_2_0020-R-2_0019.tif
2_0020_2_0021.vmo 0.055 -0.136 -0.003 38.747% 24.917% 2_0020_2_0021-L-2_0021.tif 2_0020_2_0021-R-2_0020.tif
Point: 6156047RESET measured in 4 models.
Root mean squared errors: 0.066 0.085 0.064
Maximum differences: 0.089 -0.055 0.029
Maximum differences: 0.089 -0.055 0.029
Control location: 1343310.210 864008.182 3978.440
Model specific Data
ModelName resX resY resZ RadL RadR LeftImage RightImage
1_0012_1_0013.vmo 0.089 -0.098 0.023 63.483% 38.545% 1_0012_1_0013-L-1_0012.tif 1_0012_1_0013-R-1_0013.tif
1_0013_1_0014.vmo 0.064 -0.079 0.029 38.545% 52.193% 1_0013_1_0014-L-1_0013.tif 1_0013_1_0014-R-1_0014.tif
2_0019_2_0020.vmo -0.043 -0.055 -0.112 62.599% 72.354% 2_0019_2_0020-L-2_0020.tif 2_0019_2_0020-R-2_0019.tif
2_0020_2_0021.vmo 0.061 -0.100 -0.046 79.413% 62.599% 2_0020_2_0021-L-2_0021.tif 2_0020_2_0021-R-2_0020.tif
Point: 6086047RESET measured in 4 models.
Root mean squared errors: 0.090 0.104 0.118
Maximum differences: 0.154 -0.082 -0.011
Maximum differences: 0.154 -0.082 -0.011
Control location: 1340546.900 862936.033 4054.010
Model specific Data
ModelName resX resY resZ RadL RadR LeftImage RightImage
1_0007_1_0008.vmo 0.154 -0.130 -0.202 70.131% 50.225% 1_0007_1_0008-L-1_0007.tif 1_0007_1_0008-R-1_0008.tif
1_0008_1_0009.vmo 0.085 -0.085 -0.110 50.224% 62.514% 1_0008_1_0009-L-1_0008.tif 1_0008_1_0009-R-1_0009.tif
2_0024_2_0025.vmo -0.016 -0.082 -0.056 24.135% 43.869% 2_0024_2_0025-L-2_0025.tif 2_0024_2_0025-R-2_0024.tif
2_0025_2_0026.vmo 0.030 -0.109 -0.011 52.021% 24.138% 2_0025_2_0026-L-2_0026.tif 2_0025_2_0026-R-2_0025.tif
Point: 6136047RESET measured in 1 models.
Root mean squared errors: 0.007 0.114 0.041
Maximum differences: 0.007 -0.114 -0.041
Maximum differences: 0.007 -0.114 -0.041
Control location: 1338584.006 863196.732 4060.290
Model specific Data
ModelName resX resY resZ RadL RadR LeftImage RightImage
2_0028_2_0029.vmo 0.007 -0.114 -0.041 16.280% 26.182% 2_0028_2_0029-L-2_0029.tif 2_0028_2_0029-R-2_0028.tif
Point: 6116047 measured in 3 models.
Root mean squared errors: 0.024 0.053 0.126
Maximum differences: 0.038 0.013 0.005
Maximum differences: 0.038 0.013 0.005
Control location: 1340660.240 864082.595 3999.920
Model specific Data
ModelName resX resY resZ RadL RadR LeftImage RightImage
1_0008_1_0009.vmo 0.038 0.013 -0.084 44.698% 51.758% 1_0008_1_0009-L-1_0008.tif 1_0008_1_0009-R-1_0009.tif
2_0024_2_0025.vmo -0.016 -0.000 -0.202 65.695% 71.952% 2_0024_2_0025-L-2_0025.tif 2_0024_2_0025-R-2_0024.tif
2_0025_2_0026.vmo 0.002 -0.090 0.005 82.368% 65.696% 2_0025_2_0026-L-2_0026.tif 2_0025_2_0026-R-2_0025.tif
Point: 45YRESET measured in 4 models.
Root mean squared errors: 0.077 0.076 0.119
Maximum differences: 0.103 -0.061 -0.006
Maximum differences: 0.103 -0.061 -0.006
Control location: 1340052.418 863570.699 4037.670
Model specific Data
ModelName resX resY resZ RadL RadR LeftImage RightImage
1_0006_1_0007.vmo 0.085 -0.089 -0.177 52.765% 7.645% 1_0006_1_0007-L-1_0006.tif 1_0006_1_0007-R-1_0007.tif
1_0007_1_0008.vmo 0.103 -0.068 -0.037 7.647% 35.497% 1_0007_1_0008-L-1_0007.tif 1_0007_1_0008-R-1_0008.tif
2_0025_2_0026.vmo 0.031 -0.082 -0.006 25.852% 43.126% 2_0025_2_0026-L-2_0026.tif 2_0025_2_0026-R-2_0025.tif
2_0026_2_0027.vmo 0.069 -0.061 -0.155 53.661% 25.852% 2_0026_2_0027-L-2_0027.tif 2_0026_2_0027-R-2_0026.tif
Point: C5133 measured in 2 models.
Root mean squared errors: 0.033 0.065 0.214
Maximum differences: 0.047 -0.047 -0.189
Maximum differences: 0.047 -0.047 -0.189
Control location: 1342293.507 863449.485 4005.610
Model specific Data
ModelName resX resY resZ RadL RadR LeftImage RightImage
1_0011_1_0012.vmo 0.047 -0.047 -0.189 15.175% 28.342% 1_0011_1_0012-L-1_0011.tif 1_0011_1_0012-R-1_0012.tif
2_0021_2_0022.vmo 0.001 -0.080 -0.237 24.088% 40.927% 2_0021_2_0022-L-2_0022.tif 2_0021_2_0022-R-2_0021.tif
Point: 6126047RESET measured in 1 models.
Root mean squared errors: 0.047 0.101 0.030
Maximum differences: 0.047 -0.101 0.030
Maximum differences: 0.047 -0.101 0.030
Control location: 1338565.774 864105.968 4021.140
Model specific Data
ModelName resX resY resZ RadL RadR LeftImage RightImage
2_0028_2_0029.vmo 0.047 -0.101 0.030 65.589% 69.976% 2_0028_2_0029-L-2_0029.tif 2_0028_2_0029-R-2_0028.tif